The site transactionfee.info has been deprecated in favor of mainnet.observer. You will be redirected in 5 seconds. If you are not redirected, click here.
If you don't want to be redirected, append this to the URL: ?noredirect=true
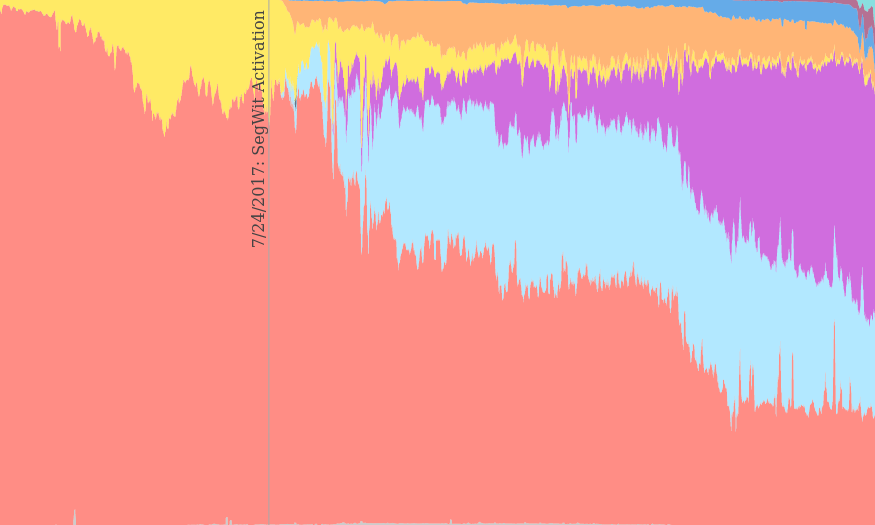
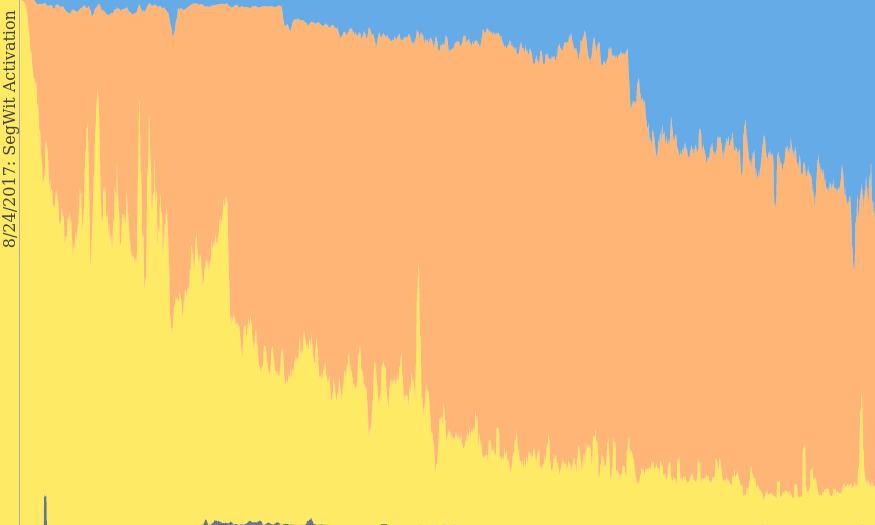
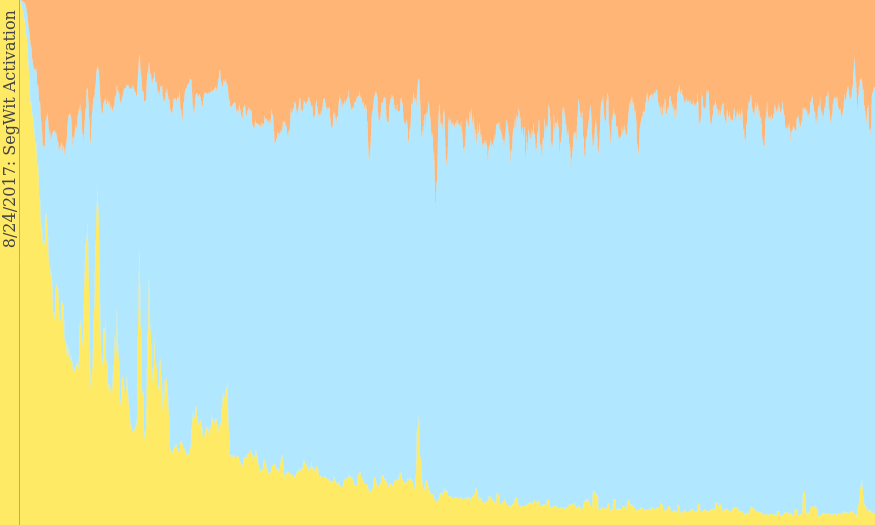
Output Types by Count
Shows the distribution of output types by output count per day.