P2SH Input Type Distribution
Shows the distribution of P2SH inputs across normal P2SH, Nested-P2WPKH, and Nested-P2WSH by count.0 - moon
moving average
Related Charts
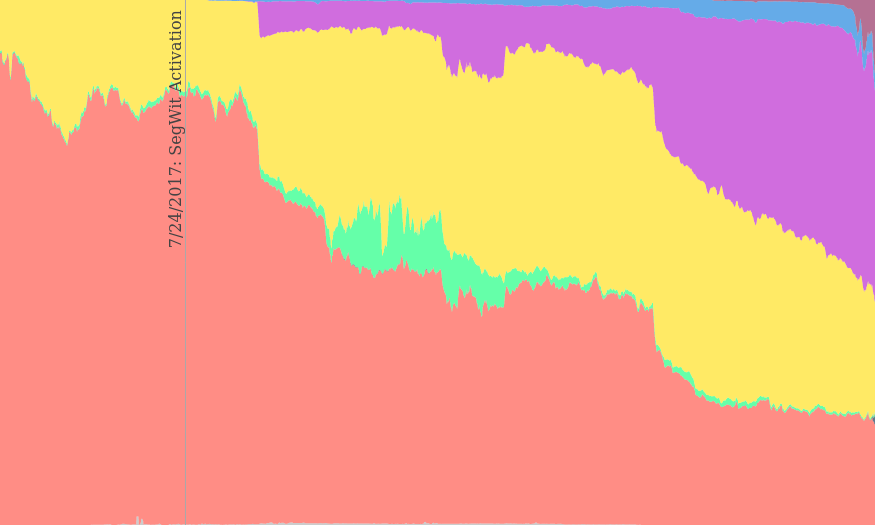
Input Types by Count
Shows the distribution of input types per day.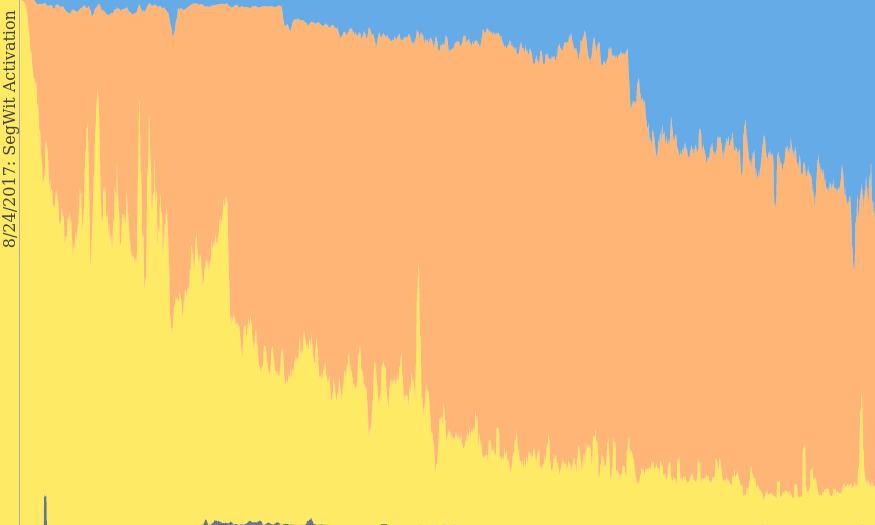
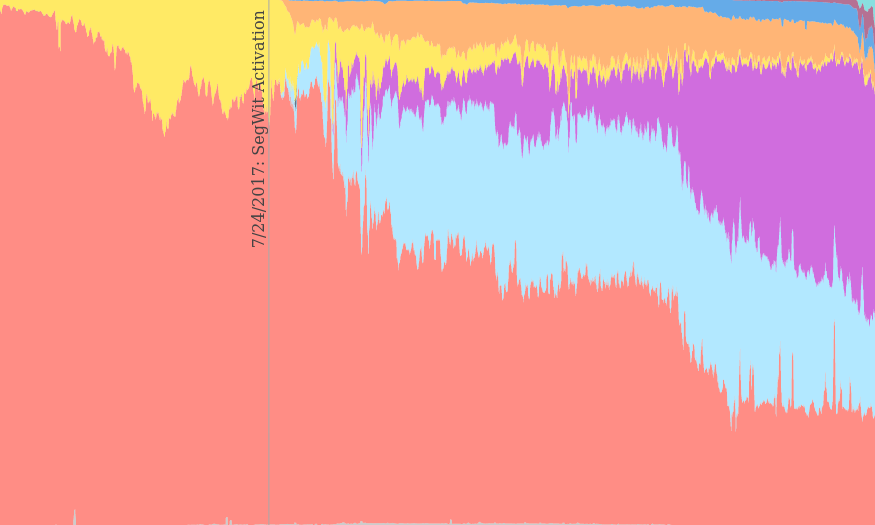
Multisig Input Types
Shows the distribution of multisig spends for each input type per day.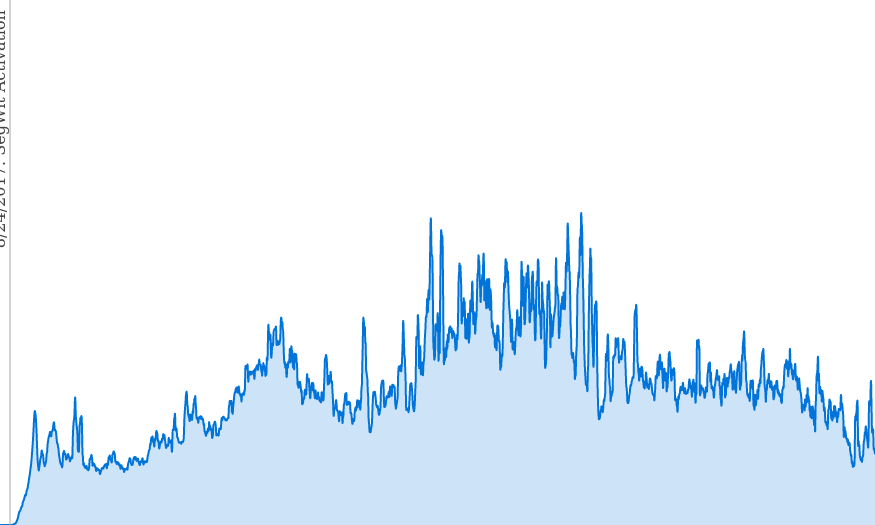
Nested P2WSH Inputs
Shows the number of Nested P2WSH inputs per day.